Overview of Diffmah and DiffmahPop
Starting from a collection of best-fitting approximations to halo merger trees, you can use the calc_halo_history function to compute the assembly history for every halo in the sample. Here we’ll just demonstrate a few simple cases.
Note that in these examples, we pass in arbitrary values for the early- and late-time indices. However, for real halos (and also for the results returned by the diffmah-provided MAH fitting script), \(0 < \alpha_{\rm late} < \alpha_{\rm early}.\)
[1]:
import numpy as np
from matplotlib import pyplot as plt
import matplotlib.cm as cm
[2]:
from diffmah import mah_halopop, DEFAULT_MAH_PARAMS
n_halos, n_times = 50, 100
tarr = np.linspace(0.5, 13.8, n_times)
logt0 = np.log10(tarr[-1])
colors=cm.coolwarm(np.linspace(1, 0, n_halos)) # red first
ZZ = np.zeros(n_halos)
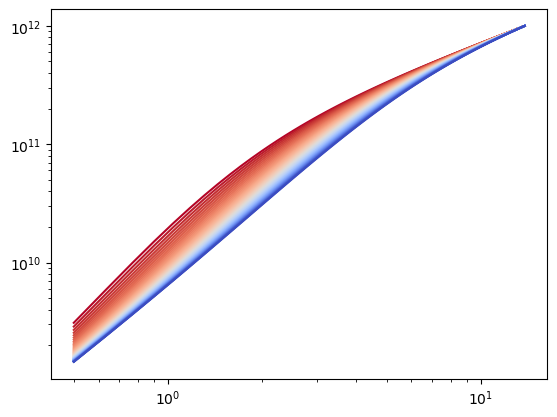
logtc = np.log10(np.linspace(1, 5, n_halos))
logm0 = 12 + ZZ
early, late = 2 + ZZ, 1 + ZZ
t_peak = 14.0 + ZZ
mah_params = DEFAULT_MAH_PARAMS._make((logm0, logtc, early, late, t_peak))
dmhdt, log_mah = mah_halopop(mah_params, tarr, logt0)
fig, ax = plt.subplots(1, 1)
__=ax.loglog()
for ih in range(n_halos):
__=ax.plot(tarr, 10**log_mah[ih, :], color=colors[ih])
[3]:
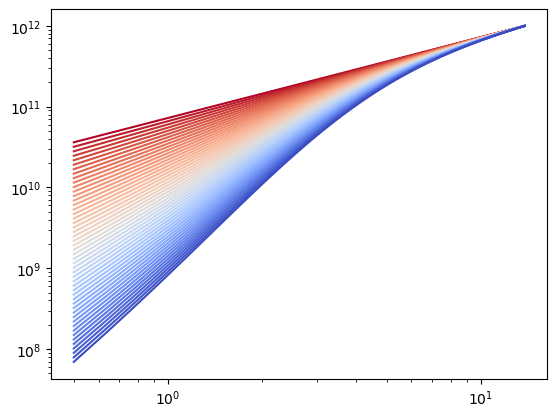
logtc = 0.5 + ZZ
early = np.linspace(1, 3, n_halos)
late = 1 + ZZ
mah_params = DEFAULT_MAH_PARAMS._make((logm0, logtc, early, late, t_peak))
dmhdt, log_mah = mah_halopop(mah_params, tarr, logt0)


fig, ax = plt.subplots(1, 1)
__=ax.loglog()
for ih in range(n_halos):
    __=ax.plot(tarr, 10**log_mah[ih, :], color=colors[ih])
[4]:
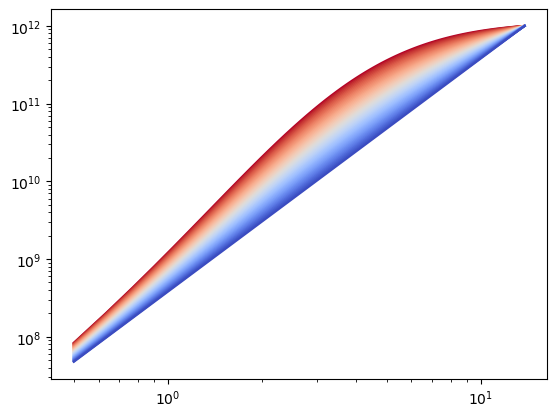
tauc = 2.0
early = 3 + ZZ
late = np.linspace(0.01, 3, n_halos)
mah_params = DEFAULT_MAH_PARAMS._make((logm0, logtc, early, late, t_peak))
dmhdt, log_mah = mah_halopop(mah_params, tarr, logt0)

fig, ax = plt.subplots(1, 1)
__=ax.loglog()
for ih in range(n_halos):
    __=ax.plot(tarr, 10**log_mah[ih, :], color=colors[ih])
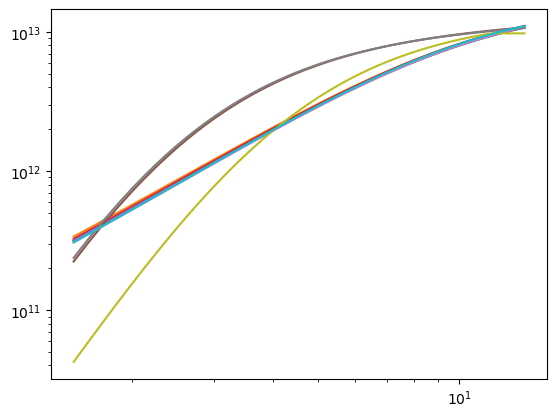
Generating Monte Carlo realizations of halo MAHs with DiffmahPop
[5]:
from jax import random as jran
ran_key = jran.key(10)
[6]:
from diffmah.diffmahpop_kernels import mc_cenpop, DEFAULT_DIFFMAHPOP_PARAMS

cosmic_time = np.linspace(1.5, 13.8, 100)

n_halos = 10
lgm_obs = np.zeros(n_halos) + 13
t_obs = np.zeros(n_halos) + 13.5

halopop = mc_cenpop(DEFAULT_DIFFMAHPOP_PARAMS, cosmic_time, lgm_obs, t_obs, ran_key, logt0)

fig, ax = plt.subplots(1, 1)
__=ax.loglog()
for ih in range(n_halos):
    __=ax.plot(cosmic_time, 10**halopop.log_mah[ih, :])
[ ]: